Continue reading “EasyBudget Chart Data and Building Charts”

Continue reading “EasyBudget Chart Data and Building Charts”

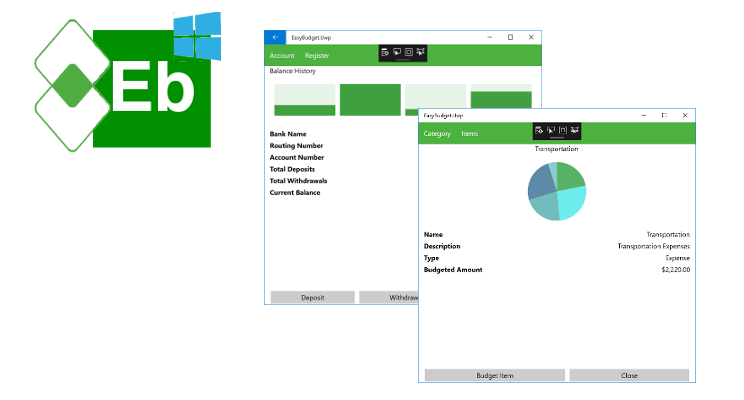
![]() The EasyBudget project is almost ready to start adding the status page and charts. I was convinced that OxyPlot was the package I wanted to use. It’s Open Source, is relatively easy to use, and produces some nice graphs and charts.
The EasyBudget project is almost ready to start adding the status page and charts. I was convinced that OxyPlot was the package I wanted to use. It’s Open Source, is relatively easy to use, and produces some nice graphs and charts.
This has now officially changed.
 What exactly is a RESTful Service? REST is an acronym for REpresentational State Transfer. It is a way of representing the data requested of, or sent to a web service in such a way that the server understands exactly what is being requested or sent, along with what the server should do with it and what it should send back to the client.

Years ago, I read a book titled “Head First Design Patterns” by Eric Freeman & Elisabeth Freeman with Kathy Sierra & Bert Bates. This book, along with a few blogs and magazine articles, introduced me to software design patterns.